The Mandelbrot set
Pick a complex number c, start at z = 0 and keep applying z → z² + c. If the numbers stay bounded, c is in the Mandelbrot set. That one rule draws the most famous shape in mathematics, whose edge shows new detail however far you zoom in.
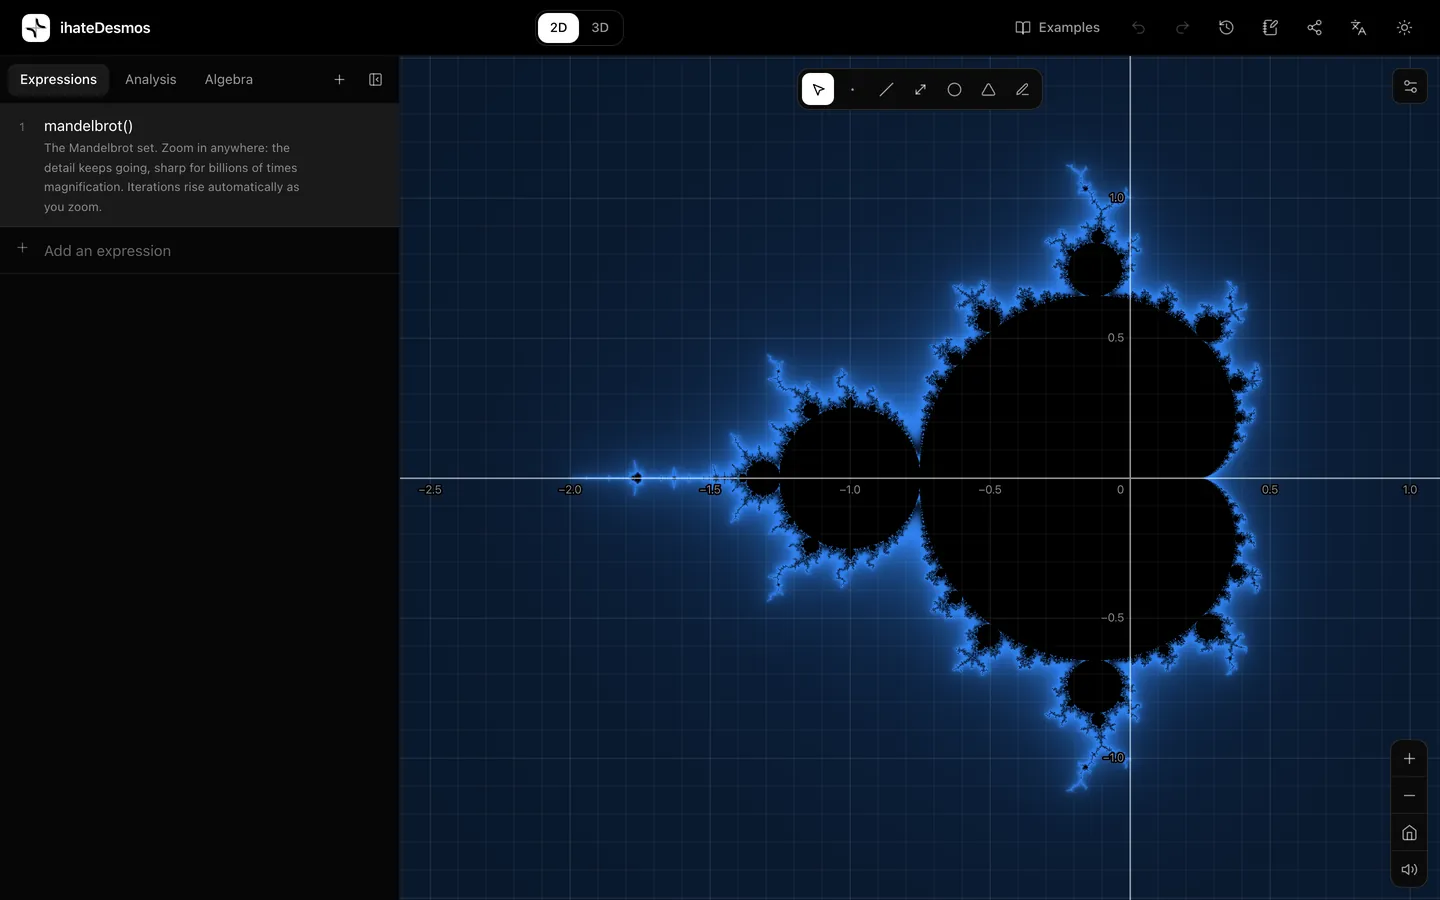
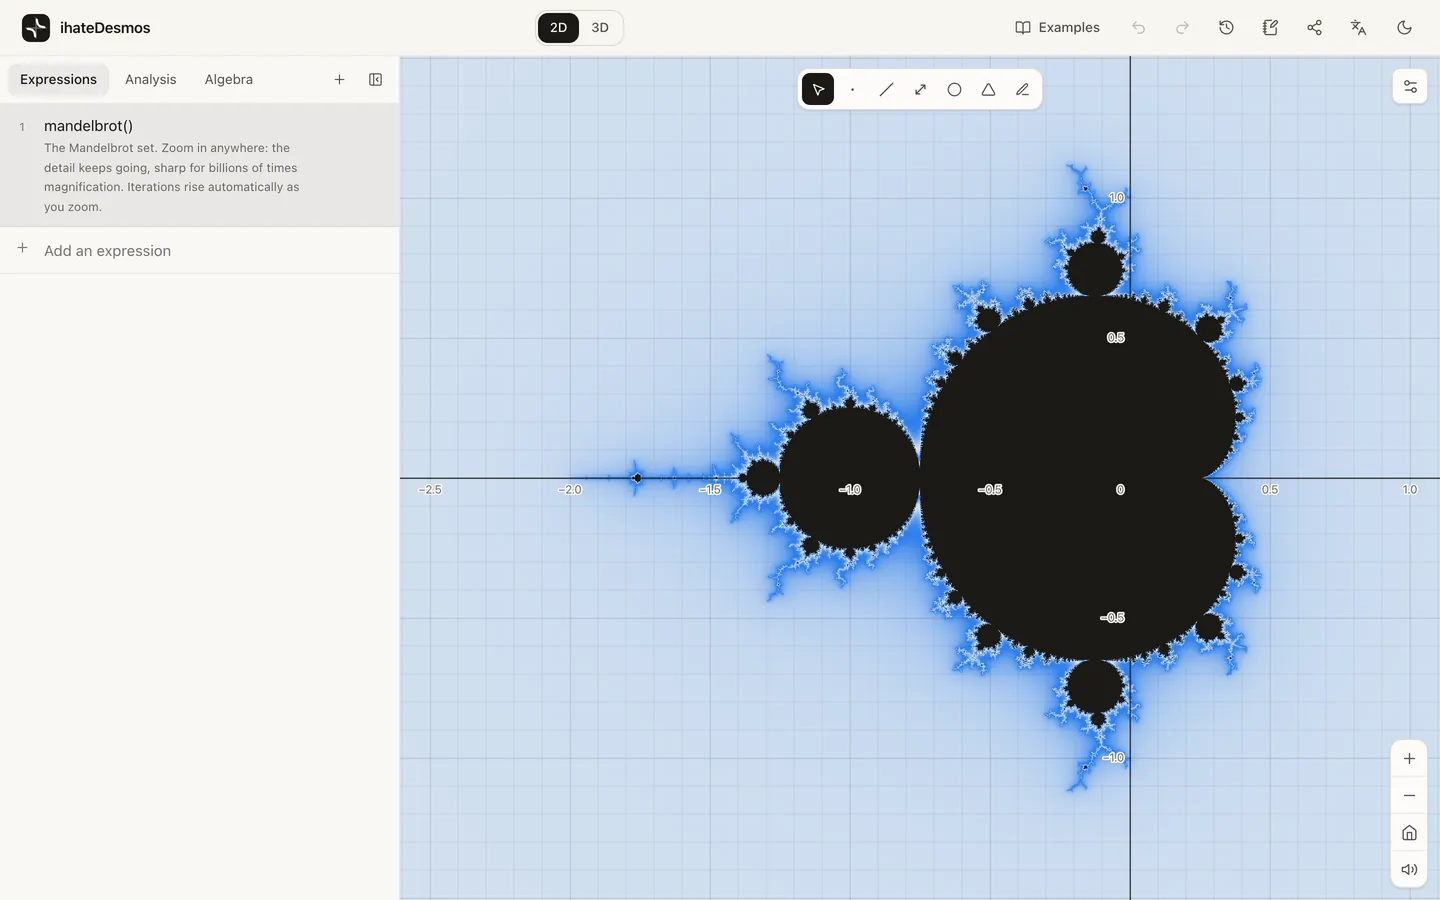
mandelbrot() into the calculator, then scroll or pinch to zoom in anywhere. Outside the set, the colour bands count how quickly each point escapes.Equations to type
mandelbrot()mandelbrot(60)mandelbrot()mandelbrot()julia(-0.8, 0.156)julia(a, b) a = -0.4 b = 0.6At a glance
- Rule
- z₀ = 0, zₙ₊₁ = zₙ² + c; c is in the set when |zₙ| never exceeds 2
- Where it lies
- Inside the disc |c| ≤ 2; on the real axis it is the interval [−2, ¼]
- Area
- About 1.5066, known only from numerical estimates
- Boundary
- Hausdorff dimension 2 (Shishikura, 1998)
The rule
Every point of the plane stands for a complex number c = a + bi. Start with z = 0 and apply z → z² + c over and over: 0, c, c² + c, (c² + c)² + c, and so on. For c = −1 the numbers cycle 0, −1, 0, −1 for ever, so −1 is in the set. For c = 1 they run 0, 1, 2, 5, 26, … off to infinity, so 1 is not.
A short argument shows that once |z| passes 2 the sequence must escape, so a computer only has to iterate until |z| > 2 or until it runs out of patience. Points that are still bounded after the last iteration are coloured as inside. That is why more iterations reveal more detail at the edge, and why the calculator raises the count automatically as you zoom in.
The cardioid and the bulbs
The large heart shape is a cardioid, the set of c for which z² + c has an attracting fixed point. Its edge is c = eit/2 − e2it/4. The round bulb to its left is exactly the disc of radius ¼ centred at −1, where the orbit settles into a cycle of period 2.
Every bulb has a period, and you can read it off the picture: count the arms of the antenna on top of it. Between two bulbs on the cardioid, the largest bulb has a period equal to the sum of theirs, the same pattern as the Farey fractions. Look closely at the filaments and you find tiny copies of the whole set, each with its own cardioid and bulbs. The equations above open one of them near −1.77.
Julia sets
Fix c instead and let the starting point vary: the points whose orbits stay bounded make the filled Julia set of c, and julia(a, b) draws it for c = a + bi. The Mandelbrot set is a map of all of them. When c is inside it, the Julia set is one connected piece; when c is outside, the Julia set falls apart into dust. This is why Mandelbrot’s set is defined by the orbit of 0: 0 is the one critical point of z² + c, and its fate decides the shape of the whole Julia set.
Open the slider example and drag a and b. Near the edge of the Mandelbrot set the Julia sets are the most intricate, and they often look like the part of the Mandelbrot set around c.
History
Pierre Fatou and Gaston Julia studied iterated complex functions around 1918, without computers to draw them. Robert Brooks and Peter Matelski printed a crude picture of the set in 1978, and Benoît Mandelbrot, working at IBM, produced and published sharper images in 1980. Adrien Douady and John Hubbard proved in 1982 that the set is connected and named it after Mandelbrot. Whether it is also locally connected (the MLC conjecture) is still one of the main open problems in the field.
How it is drawn here
Every pixel is computed on your graphics card, so the picture redraws as fast as you can pan and zoom. Ordinary GPU numbers carry about seven significant digits, which would turn the picture into blocks after zooming in about 100,000 times. To go deeper, the calculator uses perturbation: it computes one reference orbit in full double precision, and each pixel only tracks its small difference from that orbit, restarting the comparison whenever the difference stops being small. The picture stays sharp all the way to the calculator’s deepest zoom, several billion times magnification.
The colours come from a smooth version of the escape count, so bands blend instead of stepping. Browsers without WebGL2 fall back to plain GPU numbers, which blur sooner.
Frequently asked questions
What is the Mandelbrot set?
What is the equation of the Mandelbrot set?
How do I draw the Mandelbrot set?
Does the detail really go on for ever?
What is the area of the Mandelbrot set?
What is the difference between the Mandelbrot set and a Julia set?
More curves
r = 1 + cos θ: a circle rolling around a circle.
Chaos in three equations: the butterfly effect.
Temple Fay’s transcendental butterfly from 1989.
r = cos(kθ): k petals for odd k, 2k for even.
Several equations that draw a heart, and why they work.
r = aθ, r = e^(bθ) and r² = θ: three kinds of spiral.
Every equation on this page opens in the calculator, where you can add sliders and watch the curve change.