The free graphing calculator that shows its work.
Graph functions, equations and data in 2D and 3D, then see the algebra behind them. Exact plotting, a real computer algebra system, statistics, slope fields and notebooks, free and right in your browser.
- No sign-up
- Works offline
- Nothing uploaded
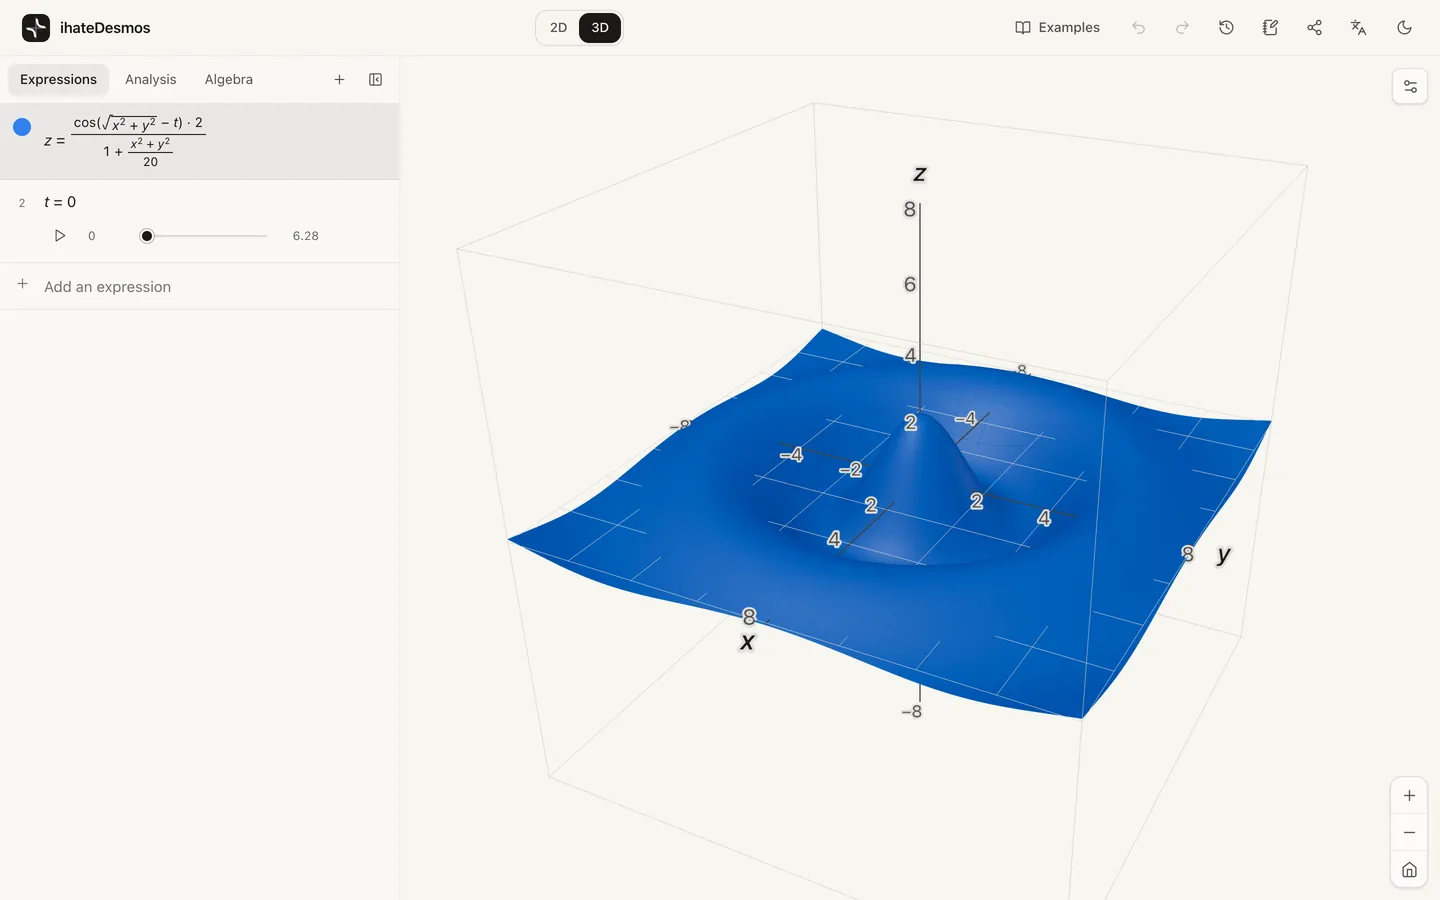
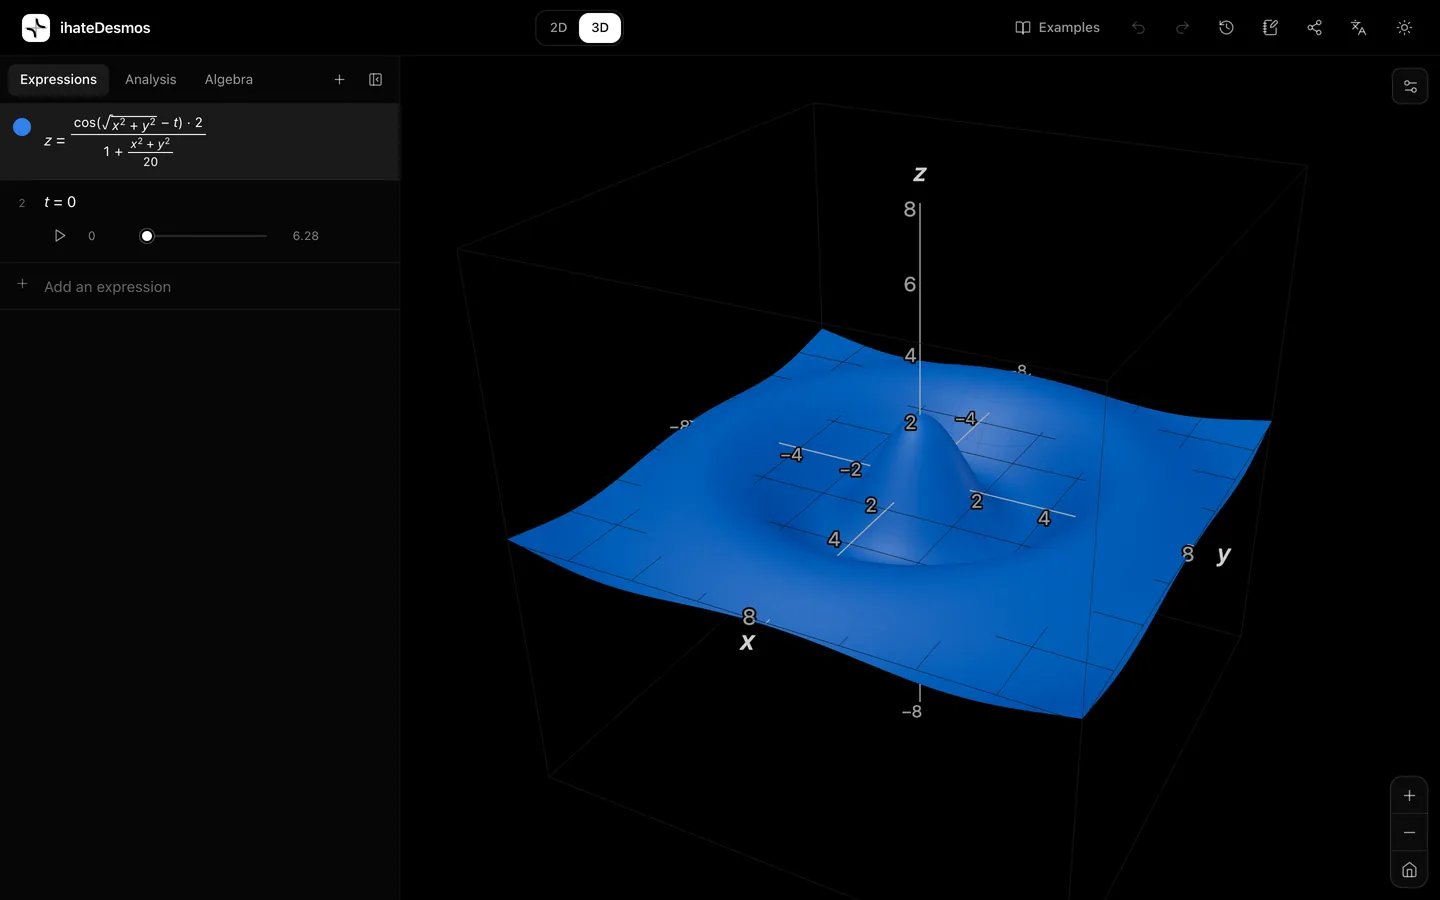
Right answers, not almost-right ones.
Floating-point arithmetic is full of small lies. ihateDesmos compiles every expression, handles the special cases exactly, and tells you how accurate a numerical answer is. These values were computed by the engine when this page was built.
Curves that other graphers can miss
Most plotters look for places where a function changes sign. (x² + y² − 9)² = 0 is a circle, but the left side never goes negative, so there is no sign change to find. Certified mode uses interval arithmetic to prove which pixels can contain the curve, so it is drawn anyway.
Algebra, not just pictures.
A computer algebra system sits next to the graph. Factor and solve exactly, get antiderivatives, limits and Taylor series, and see the rules behind a derivative. Each result is ordinary maths you can graph with one click.
- Simplify, expand, factor and partial fractions
- Exact solutions, with numeric roots when there is no formula
- Antiderivatives, definite integrals, limits and Taylor series
- Exact-form recognition and 50-digit evaluation
- Product rule: (f·g)′ = f′·g + f·g′ with f = x^2, g = sin(x)
- f′ = 2x, g′ = cos(x)
- Power rule: d/dx[x^2] = 2 · (x)^(2 − 1)
Every kind of graph, in one place.
Type it the way you’d write it. The calculator works out what kind of graph it is.
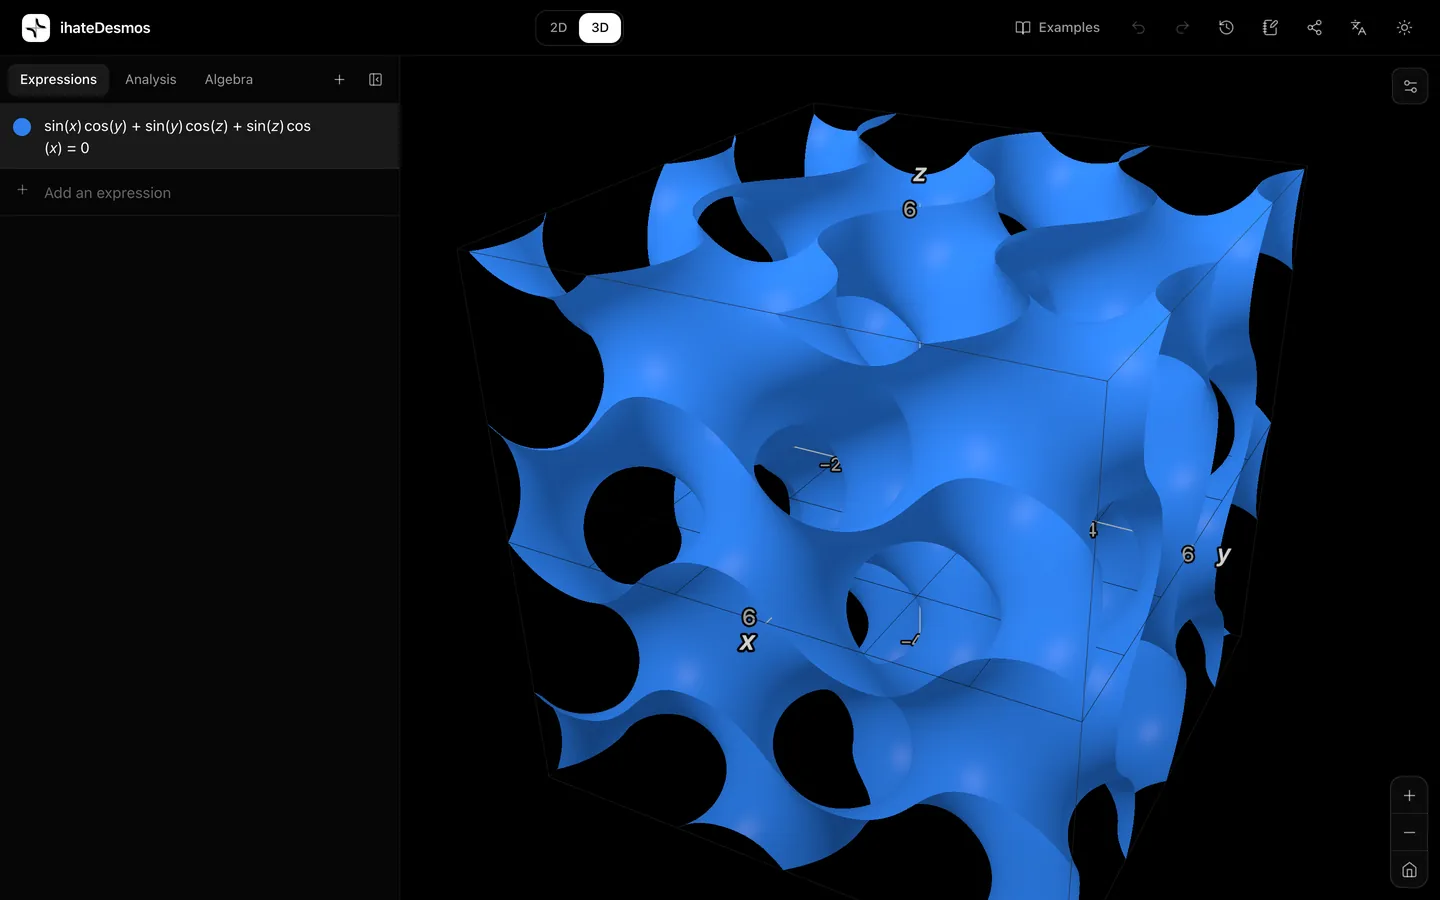
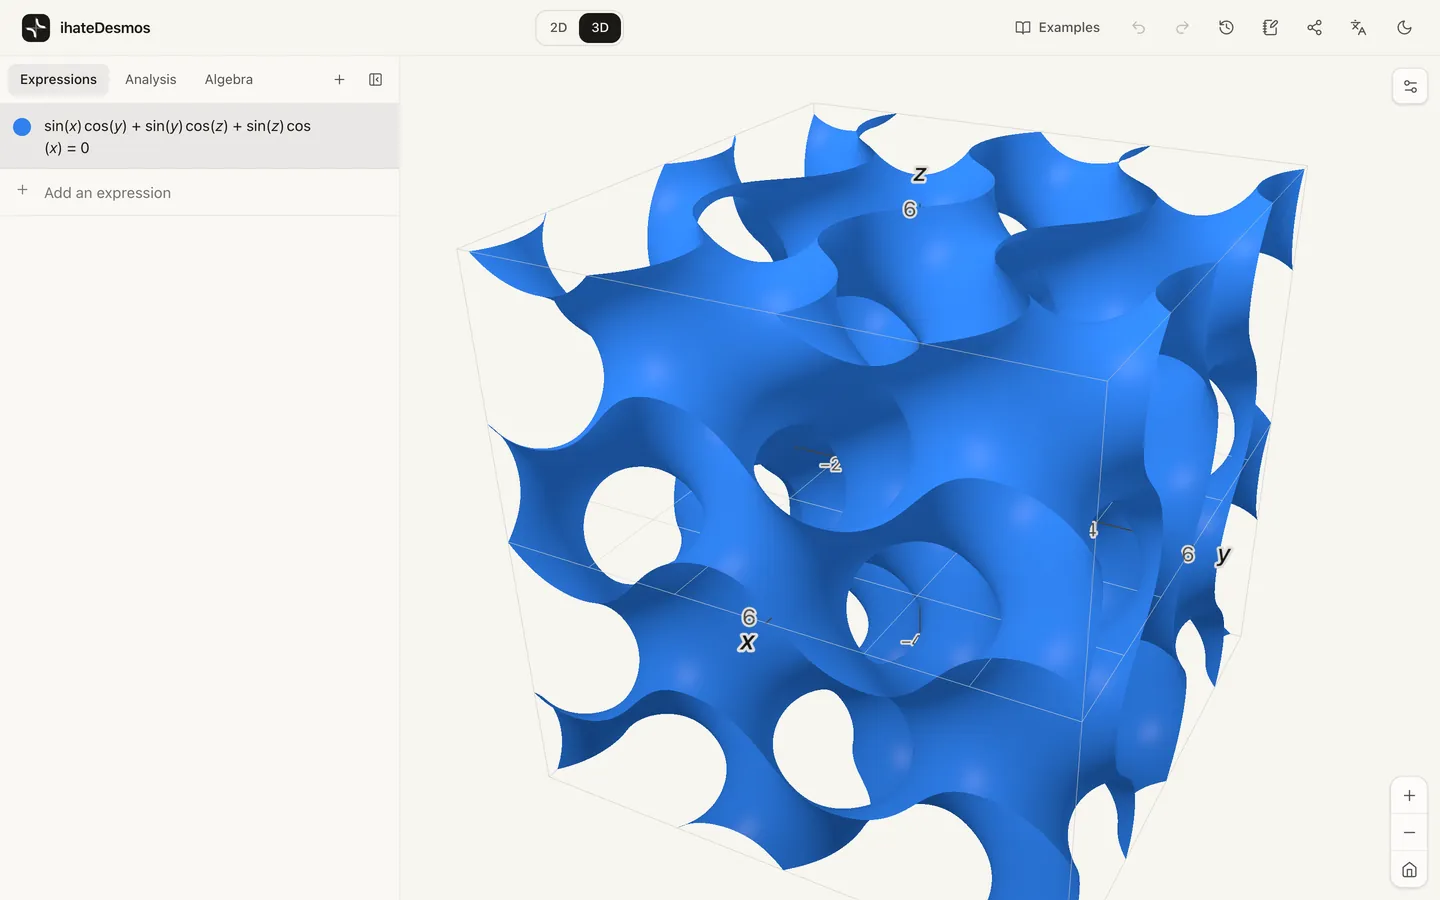
3D that stays sharp at any zoom.
Implicit surfaces are ray-traced pixel by pixel on your graphics card, so a gyroid or a sphere has no mesh facets however close you get. Heavier surfaces are built in the background, so typing never stutters.
- Surfaces, implicit surfaces, parametric curves and surfaces
- Vector fields and 3D systems like the Lorenz attractor
- Tangent planes, normals and Lagrange multipliers
- Export as STL or OBJ for 3D printing, or view in AR on supported phones
Statistics with honest error bars.
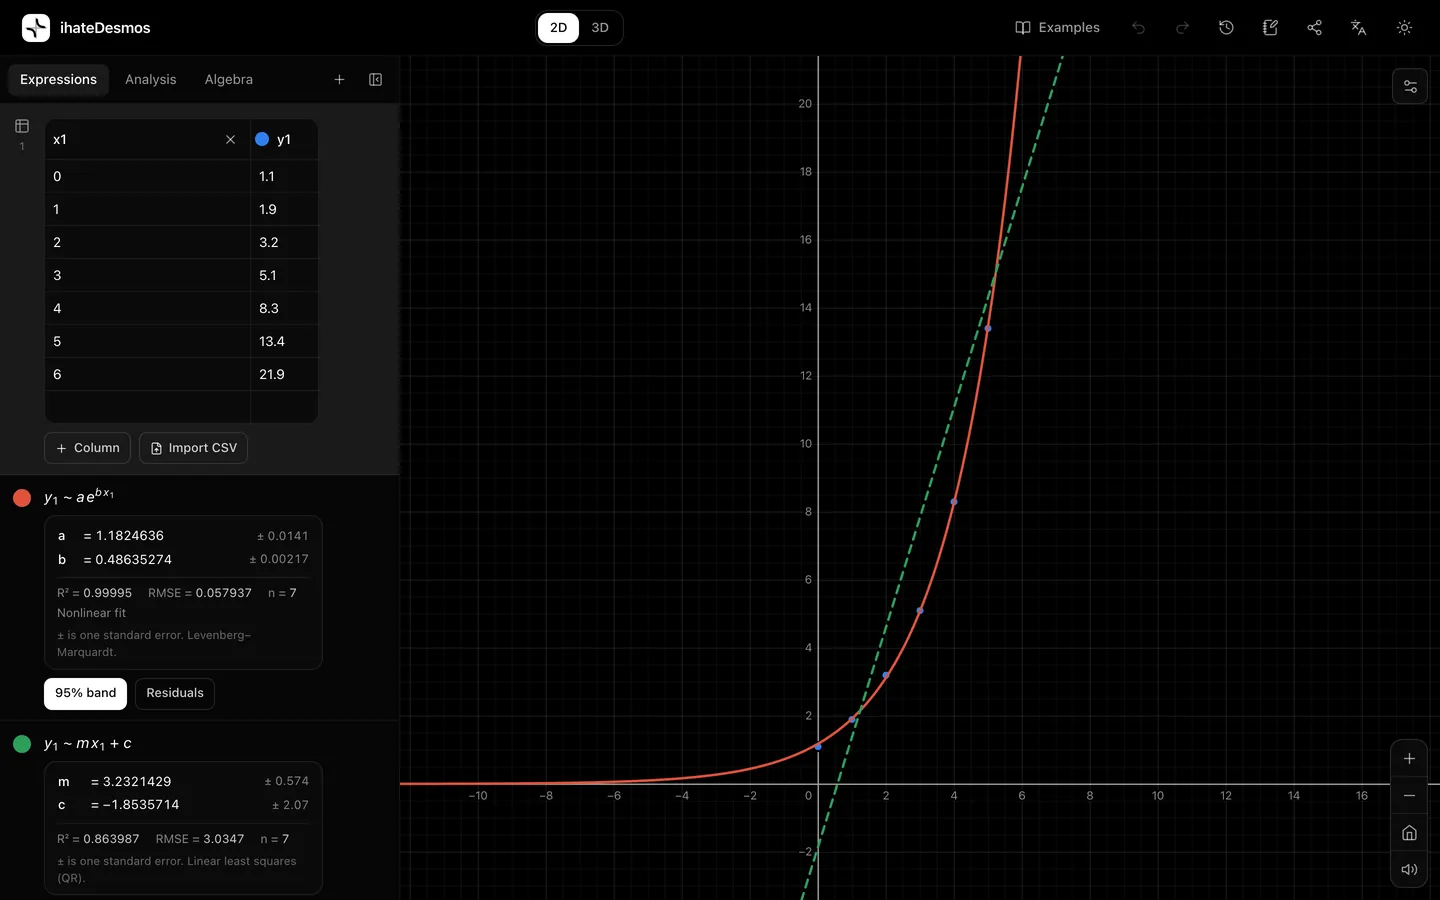
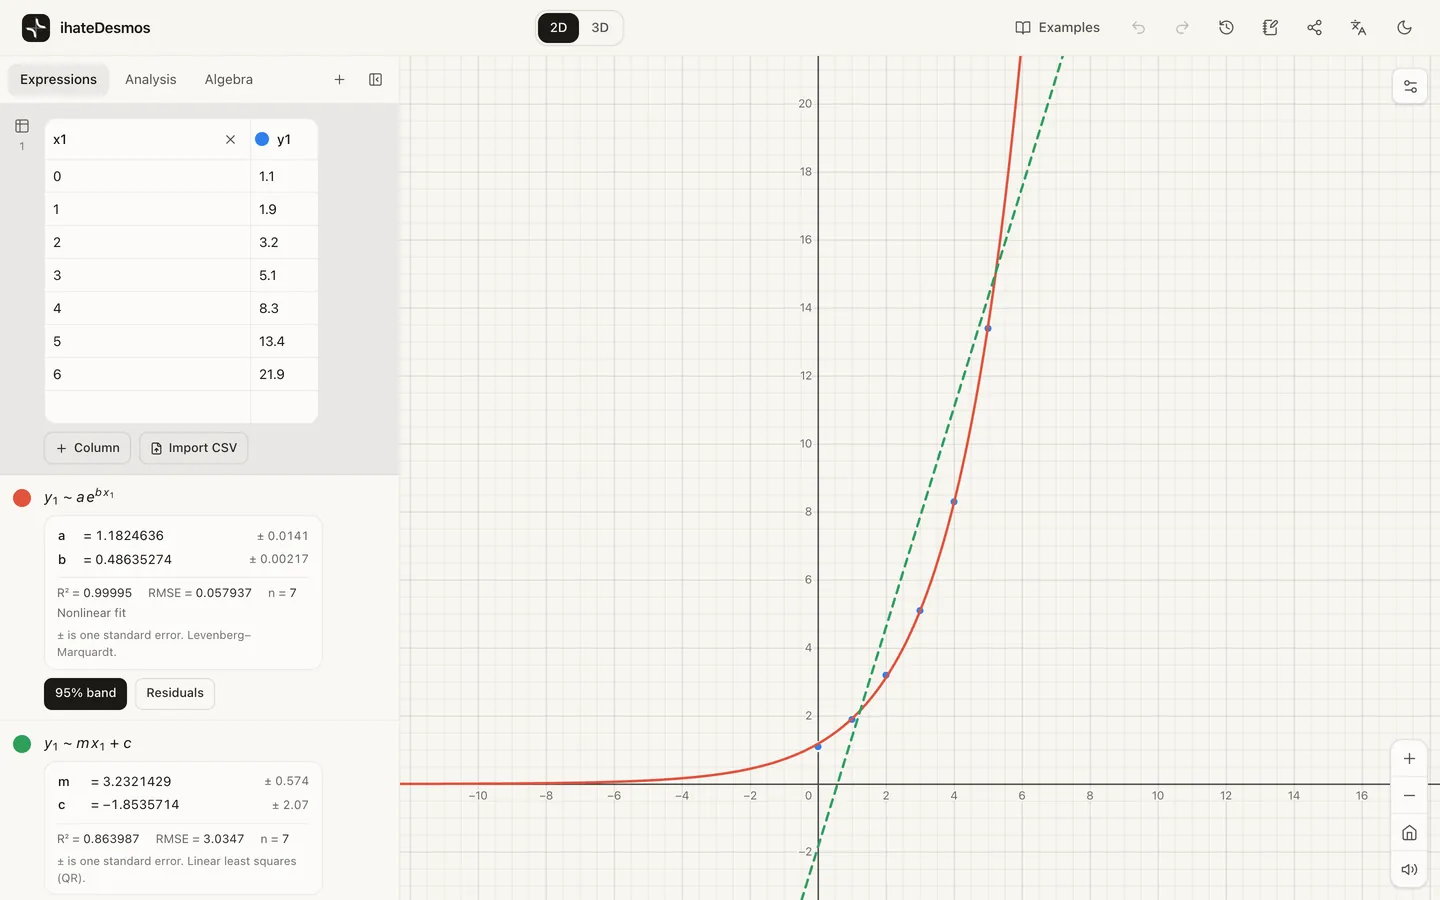
Paste a table or import a CSV, then fit any model you can write down. Linear models are solved exactly with QR decomposition and nonlinear ones with Levenberg–Marquardt, and every parameter comes with its standard error and a 95% confidence band.
- Linear, polynomial, exponential and any custom model
- R², RMSE, residual plots and confidence bands
- Distributions with exact CDFs: normal, t, χ², binomial, Poisson
- Histograms, box plots, dot plots and FFT spectra
Write it up without leaving the graph.
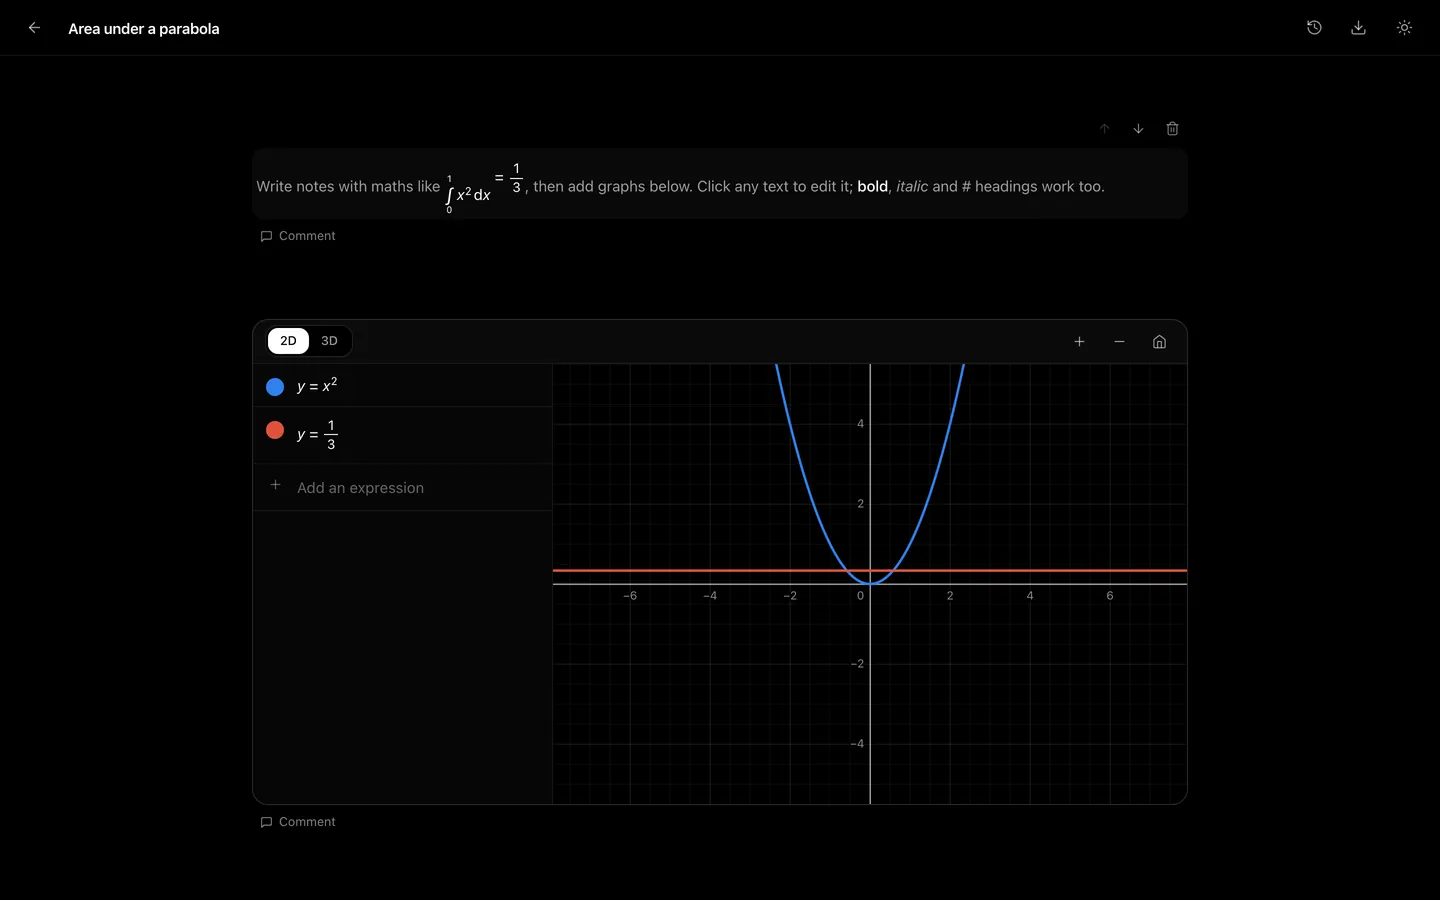
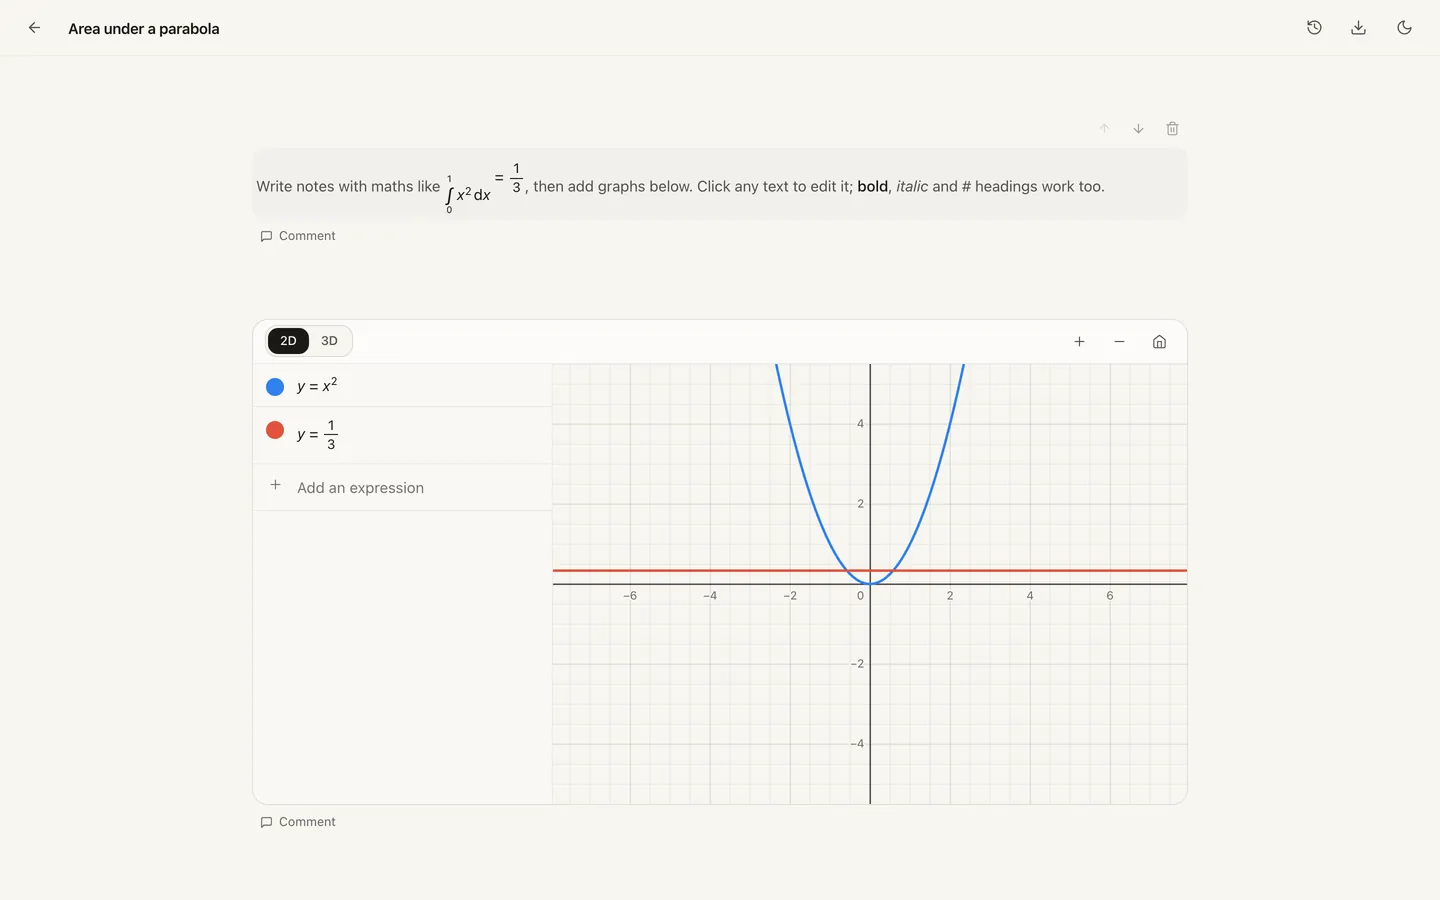
Notebooks mix prose, typeset maths and live graphs in one document. Leave comments, keep a full version history, and export the whole thing as a file. Everything stays in your browser.
- Markdown text with inline and display maths
- Any number of independent live graphs
- Comments, version history and live sync between your tabs
Everything else you’ll reach for.
Roots, extrema, inflection points and integrals by adaptive Gauss–Kronrod quadrature, each with its accuracy.
Families of curves from one row, animated sliders, and actions that update values for simulations and games.
Slope fields, phase portraits and solutions through points you drag, plus heat and wave equations.
Domain colouring, conformal maps and Riemann surfaces for functions of a complex variable.
Write 9.81 m/s^2 * 3 s and get 29.43 m/s. Mismatched dimensions are caught, not silently added.
Any constant can be evaluated to 50 significant digits, and recognised as an exact form when it is one.
Screen-reader descriptions, keyboard tracing of curves, and an audio trace that plays a curve as sound.
Snapshots every few minutes and before anything replaces your work. Restore any of them in one click.
PNG, SVG and PDF for documents, TikZ for LaTeX, STL and OBJ for printing, GIF and video for slides.
A reference you can play with.
Every page explains the maths and opens straight into the calculator.
sin x, ln x, eˣ, 1/x and thirty more, with their key features computed.
Slope fields, regressions, box plots, derivatives and integrals.
Vertex form, circles, parent functions, transformations and more.
The heart curve, the Lorenz attractor, the Möbius strip and others.
Questions
Anything else? The about page explains how the calculator works.
Is ihateDesmos free?
Do I need to sign up?
Does it work offline?
Can it do 3D graphs?
Can it solve equations and show the steps?
Can I use it in exams?
Is ihateDesmos affiliated with Desmos?
Start graphing in a second.
No account, no install, no ads. Your graphs stay on your device.
Open the calculator